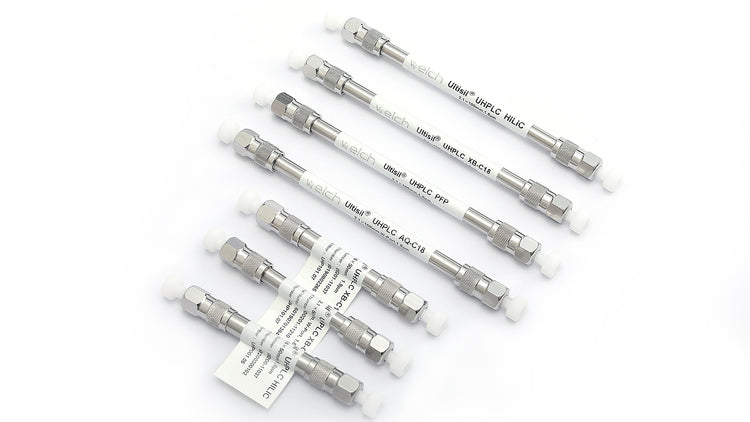
In the development process of liquid chromatography methods, the chromatographic column has the greatest impact on separation efficiency. Parameters of the chromatographic column include: bonded phase, column length, diameter, particle size, and pore size.
Engineers experienced in liquid chromatography surely remember this mnemonic:
- For columns of equal length, smaller particle size leads to better separation efficiency.
- For columns of equal particle size, longer length leads to better separation efficiency.
- For columns of equal particle size, smaller inner diameter results in a lower optimal volumetric flow rate.
Now, under the same method conditions, does a smaller particle size always guarantee better separation efficiency for columns of equal length? Join me in practical exploration to find out.
Case Study 1: Testing of Catecholamines and Metabolites
Catecholamines refer to amine compounds containing the catechol structure, which includes dopamine, norepinephrine, epinephrine, and their derivatives.

Figure 1: Xtimate® C18 (2.1*100mm, 1.8μm)
Testing of Catecholamines and Metabolites

Figure 2: Xtimate® C18 (2.1*100mm, 3μm)
Testing of Catecholamines and Metabolites
In LC-MS (liquid chromatography-tandem mass spectrometry) detection, the substances adrenaline (E), norepinephrine (NE), dopamine (DA), metanephrine (MN), and normetanephrine (NMN) exhibit high polarity.
On Welch Xtimate® C18 column (2.1*100 mm, 1.8μm), the retention of these substances is relatively weak (Figure 1). Although DA and MN can be separated in mass spectrometry, they are not well-separated on the chromatogram. In clinical testing, there is a preference for metabolites to be separated on the chromatogram as well.
Under the same conditions, by simply switching to the Xtimate® C18 column (2.1*100mm, 3μm), the retention of all five substances increases, achieving complete separation on the chromatogram (Figure 2).
Case Study 2: Separation of Impurity A and Impurity B

Figure 3 AQ-C18 (4.6*250mm, 3 μm)
Test for Impurity A and Impurity B

Figure 4 AQ-C18 (4.6*250mm, 5μm)
Test for Impurity A and Impurity B
From the two previous figures, it can be observed that, without major adjustments to the method, using a Welch AQ-C18 column (4.6*250mm, 3μm) only achieves a separation factor of 1.2 between Impurity A and Impurity B (Figure 3). Even after optimizing various parameters, the separation factor between Impurity A and Impurity B remains around 1.2.
By switching to a Welch AQ-C18 column (4.6*250mm, 5μm) and adjusting only the flow rate, the separation factor between Impurity A and Impurity B reaches 1.6 (Figure 4), meeting the analytical requirements.
Principle Analysis:
The first term of the Van Deemter equation corresponds to eddy diffusion. The chromatographic column is filled with the stationary phase packing, and the presence of these packings hinders the movement of solute molecules. The larger the particle size of the packing material, the longer the distance solute molecules ‘travel’ around the particles, meaning they spend more time within the interparticle voids.
After the analysis of the two cases, for analytes that are challenging to separate, if colleagues have tried various methods without achieving satisfactory results, it might be worth experimenting with adjusting the particle size of the chromatographic packing material, either increasing or decreasing it. Such adjustments can lead to unexpected improvements in separation efficiency!

